Teresa Poole, BelSoc Committee Member who oversaw the pollution monitoring project, writes:
Results from the community air quality monitoring study in Belsize Park / Swiss Cottage show three of our 10 locations breached the annual legal limits for nitrogen dioxide (NO2) and several other sites experienced high levels during winter months.
(The survey was funded by the Community Infrastructure Levy and Belsize Society was supported by Camden Council’s Air Quality Officers, to whom we owe our thanks. The coronavirus lockdown meant we could not hold the planned public meeting with Camden’s officers to discuss the survey results so instead Tom Parkes, Senior Air Quality Officer, kindly responded to questions submitted by the volunteers and you can find responses here. )
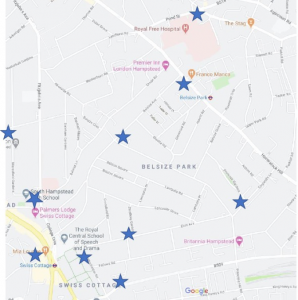
Location of monitoring tubes
These data are available thanks to the nearly 30 local volunteers who during 2019 every month dutifully retrieved diffusion test-tubes placed high up on kerbside lampposts / signposts, posted them back to Camden for analysis, and installed new tubes. Despite some tubes disappearing and occasional vandalism, a remarkable 93% of the 360 tubes deployed during the 12-month study were not tampered with and provided good data.
Our 10 monitoring locations are shown on the map. The statistical analyses produced two types of data. The overall ‘bias-adjusted’ annual mean concentrations are shown in Table 1 and have been standardised using a Defra adjustment factor to improve accuracy. The more detailed “raw” average monthly NO2 concentrations are shown in Figure 1 for each of the locations and have not been bias-adjusted.
Table 1 shows how the bias-adjusted annual mean of nearly 45 µg/m3 at the corner of Pond Street / Fleet Road breached the legal limit for NO2 (40 µg/m3), while the monitoring locations at Haverstock Hill (40.39 µg/m3) and Belsize Lane/Fitzjohn’s Avenue (40.11 µg/m3) were also slightly above the permitted limit and allowing for statistical uncertainty these locations arguably also look unhealthily high (95% confidence intervals for these annual means are not calculated by Camden Council). England’s Lane was the next worst and Winchester Road had the highest single month’s raw value (February).
| Table 1: 2019 Annual mean NO2 concentration* | ||
| Location | Monthly Graph | (µg/m3) |
| 1: Maresfield Gardens / Nutley Terrace | Figure 1 | 27.57 |
| 2: Belsize Lane / Fitzjohn’s Avenue | Figure 2 | 40.11 |
| 3: Hilgrove Estate (Belsize Road / Dobson Close) | Figure 3 | 28.66 |
| 4: Winchester Road | Figure 4 | 36.15 |
| 5: Eton Avenue | Figure 5 | 29.70 |
| 6: Adelaide Road | Figure 6 | 33.15 |
| 7: England’s Lane | Figure 7 | 38.00 |
| 8: Belsize Avenue / Belsize Park Gardens | Figure 8 | 31.92 |
| 9: Haverstock Hill | Figure 9 | 40.39 |
| 10: Pond Street / Fleet Road | Figure 10 | 44.99 |
| * Bias adjusted using the Defra April 2020 adjustment factor: https://laqm.defra.gov.uk/bias-adjustment-factors/national-bias.html | ||
While the monthly fluctuations shown in the ten Figures 1-10 are not bias-adjusted – and so cannot be compared with the 40 µg/m3 threshold – it is evident that several sites recorded a number of high monthly readings, particularly during the winter. The seasonality of the data varies at different types of monitoring locations. Generally, sites on a busy road (such as Adelaide Road and Pond Street / Fleet Road) tend to exhibit less seasonality as traffic levels are roughly constant throughout the year. In comparison, sites on a residential street (such as Eton Avenue and Maresfield Gardens / Nutley Terrace) are more strongly influenced by NO2 from domestic boilers and have NO2 profiles more closely linked to seasonal weather (albeit with some contribution from road vehicles).